Consult the fly
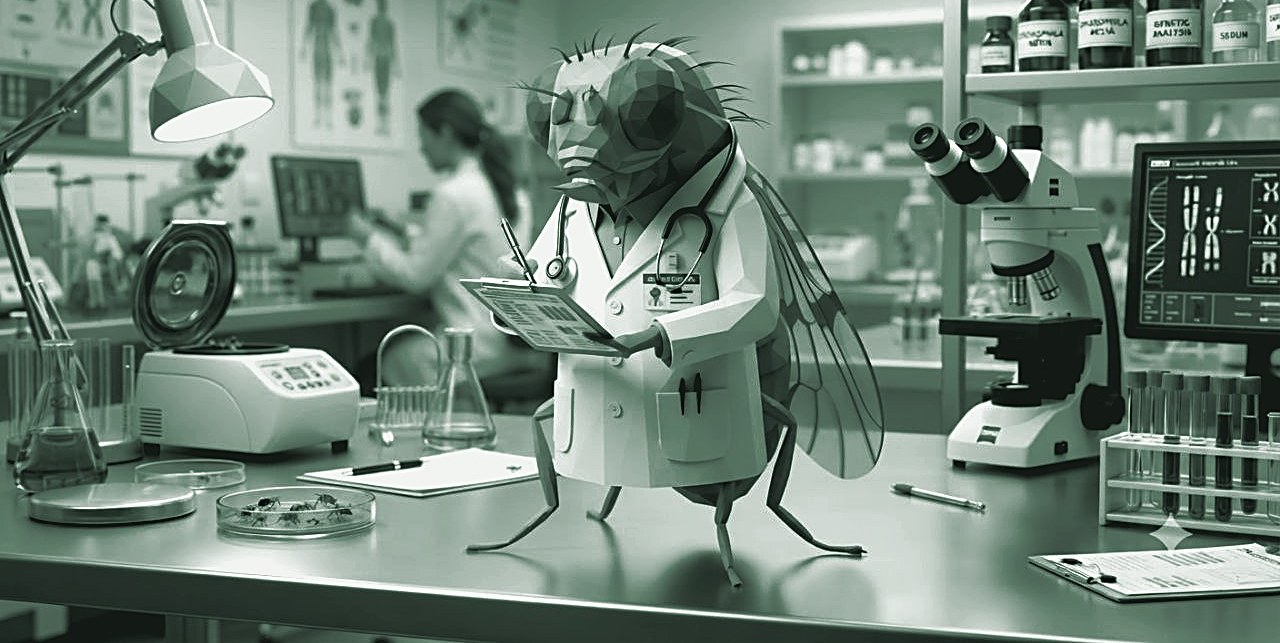
illustration · not what any of this actually looks like
A recurrent network wired like the central brain of a male fruit fly, asked to choose an antibiotic for a real Klebsiella pneumoniae isolate. It picks a drug the bacterium is actually susceptible to 86.6% of the time.
This is a joke with real data attached.
It predicts a laboratory susceptibility result, badly, and it is not a clinical tool. Everything the fly knows, it read off the resistance genes: rewire the same network at random and the score does not move. Whatever it is doing, the brain is not the part that matters.
The scoreboard
Each contestant sees one isolate’s resistance genes and names one drug. The number is the share of isolates where that single pick turned out to be a drug the laboratory called susceptible — the coverage rate, which is top-1 accuracy under another name.
One pick per isolate
For every held-out isolate the contestant names a single antibiotic, chosen only among drugs the laboratory actually tested — a median of 7 of 8, sometimes as few as one.
A hit means susceptible
Intermediate counts as a miss. That is the strict reading: an intermediate result is not a drug you would rely on.
The ± is a spread
Standard deviation across 5 seeds, not a confidence interval. Each seed redraws the split (disjoint by clonal group) and reinitialises the network.
715 to 1,260 isolates
How many are scored per seed, depending on how the split falls.
What it is called
In the antibiotic-selection literature, the coverage rate; its complement is the rate of inappropriate antibiotic therapy. In machine-learning terms, top-1 accuracy over a candidate set that changes from case to case.
The ceiling is 90.7%
The oracle is shown the laboratory result and still cannot reach 100%: for 9.3% of isolates no tested drug was susceptible at all. Those are unwinnable for everyone.
Who is competing
The recurrent network wired like the connectome. Reads the resistance genes and ranks the drugs by how likely each one is to fail.
An ordinary machine-learning model on the same gene list, with no graph anywhere in it. The comparison that matters: it does the job just as well.
Cheats: it is shown the laboratory result and takes a susceptible drug whenever one exists. Nobody can beat it, and it still reaches only 90.7%.
A caricature of prescribing under pressure: ignore the genes and reach for the broadest drug — meropenem, 94.5% of the time. It scores poorly here mostly because this collection is stuffed with carbapenem-resistant isolates (only 61% are susceptible to meropenem, where an ordinary ward would see the great majority). Real clinicians know their own ward’s patterns; this one knows nothing.
Picks at random among the drugs that were tested for that isolate. The floor.
What the real thing scores
The same coverage rate has been measured for systems built to do this for real, and for the doctors they were compared against.
The fly’s 86.6 % lands right in the middle of that. It does not belong there, and lining the numbers up side by side would be the most misleading thing on this page. Two differences pull in opposite directions, and neither can be corrected for.
Different patients. Those figures come from everyone who walked into a hospital. This collection is made of genomes somebody chose to sequence, and what gets sequenced is the interesting, drug-resistant end of the spectrum.
Different information. Every contestant here is handed a list of the bacterium’s resistance genes. A doctor prescribing empirically has none of that: the culture is still growing, the organism is unknown, and the decision cannot wait a day and a half for the answer.
So the honest reading of the scoreboard is a narrow one: it compares five ways of reading the same gene list, and nothing more. The people who do this for a living are solving a different and much harder problem.
Episode
- Organism
- Klebsiella pneumoniae
- Source
- BV-BRC, laboratory-measured
- Resistance genes detected
| Antibiotic | Fly says P(resistant) | Laboratory |
|---|
The fly never sees the laboratory column. It ranks the drugs from the gene profile alone, and the lowest one is its prescription.
The picture above is not a diagram. Each dot sits at the measured soma coordinates of that cell type, and each line is a real connection between two types; brightness is the activity the trained network actually held there at that step. Drag to turn it. One simplification: the network carries a single node per cell type, but a cell type has cells on both sides of the brain — so each type is drawn twice, and its two dots always light up together.